One of the important skills that a mathematics or science student graduating from high school ought to have is the ability to quickly visualize the graphs of basic functions. The repertoire should include power functions, polynomial functions, trigonometric functions, exponential functions, and logarithmic functions.
Having an instant and intimate knowledge of such graphs is a valuable thinking tool. For example, in a discussion about inverse-square-law forces (such as Coulomb’s law in electrostatics, or Newton’s law of gravity), knowing the shape of such a graph gives one instant insight. Saying that some quantity “decays exponentially” may not mean much, but if you can instantly call up the graph of a decaying exponential function in your mind’s eye, then the phrase is immediately meaningful. If you have basic graphs memorized, then you can follow along with full understanding when a professor is lecturing in chemistry, biology, physics, or mathematics class.
It’s not enough to be familiar with mathematics software (or a graphing calculator) so that you can type in the formula for the function and get the software to determine the graph. This reduces you to a button-pusher. You have to be able to know in advance roughly what the software is supposed to produce; otherwise, how will you know if the software’s output is erroneous, perhaps due to a typing mistake? How will you know which “window” (i.e., domain) to use for the graph if you don’t know in advance approximately where the interesting parts of the graph lie?
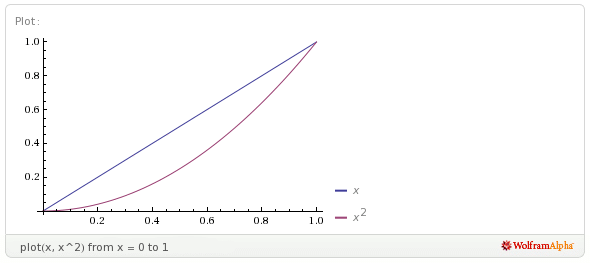
Having a good visual understanding of the basic graphs also helps to prevent thinking errors. For example, it’s a common belief that squaring a number increases it. However, this is not true for real numbers between $0$ and $1$. This is apparent from the graphs:

Notice that the values of the squares of $x$ (the red curve) are less than the corresponding values of $x$ (the blue line).
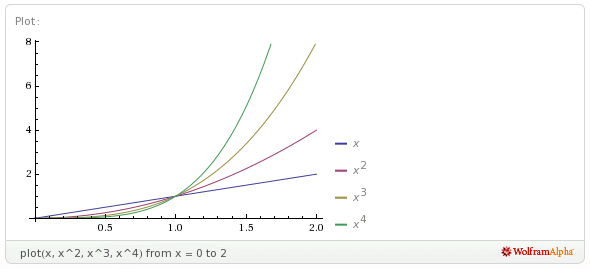
As the exponent increases, the height of the graph decreases between $0$ and $1$, but increases for $x > 1$:

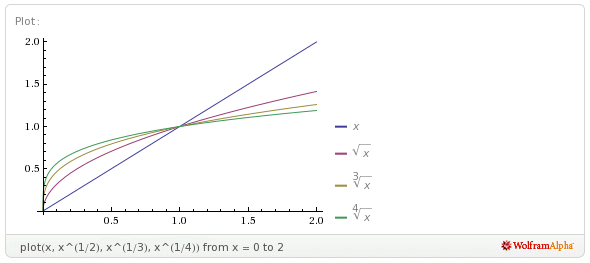
For exponents between $0$ and $1$, the behaviour is exactly the same; that is, for $0 < x < 1$, the function with the smaller exponent is higher, whereas for $x > 1$, the function with the larger exponent is higher:

Even after seeing the graphs, it may still be unclear to some people that squaring a number between $0$ and $1$ decreases it. You might help them to see this by using an area model for multiplication. To explain that $\dfrac{1}{2} \times \dfrac{1}{2} = \dfrac{1}{4}$, imagine a floor tile that has dimensions $1$ foot by $1$ foot, so that its area is $1$ square foot. If you draw two lines to divide the tile into four equal squares, the dimensions of each of the small squares is $\dfrac{1}{2}$ foot by $\dfrac{1}{2}$ foot. Thus, the area of each of the small square is $\dfrac{1}{4}$ of a square foot. But this makes sense, doesn’t it? After all, there are four small squares, all with the same area, and together they make up an area of $1$ square foot, so each of them must have an area $\dfrac{1}{4}$ the size of the large square.
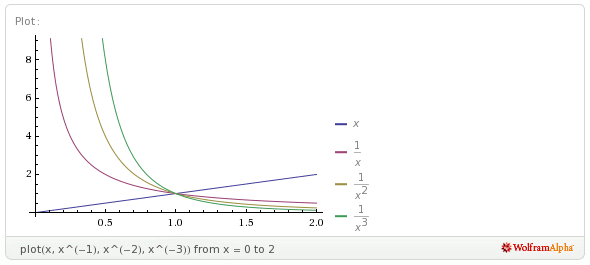
For power functions with negative exponents, the same behaviour is evident; for $0 < x < 1$, the function with the smaller exponent is higher, whereas for $x > 1$, the function with the larger exponent is higher:
For negative values of $x$, the behaviour of a power function is more complicated. Check it out for yourself, plot some representative curves (by hand, or using software), and then post the sheet in a prominent place. If you examine the sheet carefully for just a couple of minutes a day, carefully striving to understand why the graphs look the way they do, you will very soon have them memorized.
Using the power functions to solve problems, in conjunction with plotting and examining the curves, is an even better way to place them firmly in your working memory.
(This post first appeared at my other (now deleted) blog, and was transferred to this blog on 22 January 2021.)

